

Aluminum 7050 - 3.4144 - EN AW-P7050 - EN AW-AlZn6CuMgZr
Developed in the early 1970s by Alcoa, 7050 is an Al-Zn-Mg-Cu alloy with zirconium, designed to secure thick structural parts where 7075 reaches its limits.Its logic is simple : maintain strong mechanical performance and corrosion resistance through overaged tempers (T7451 and T7651 are the most common).Finally, the alloy is intended for moderate temperatures up to around 260 °C (above that, strength drops quickly).
Available shapes :
Order 7050 Online
Select the desired form, standard, or specification and place your order with one click. A member of our sales team will contact you promptly to finalize your order.
Genesis of 7050: how did it address the challenge of thick sections?
The industrial context: the resistance/corrosion compromise reached its limits
Until the 1960s, 7000-series alloys, such as 7075, were commonly used in the T6 temper. Their performance was still limited by exfoliation corrosion and stress corrosion cracking (SCC), especially on massive structural parts.
The industry first responded with the T73 temper. It improved corrosion resistance, but it also caused a significant reduction in mechanical properties. On thick products, 7075-T73 also showed clear limits: insufficient fracture toughness and high sensitivity to quench rate.
The objective: make thick structural parts more reliable
In the early 1970s, Alcoa, the Navy and the Air Force worked together to develop 7050 with one main objective: to reduce quench sensitivity in order to maintain mechanical properties in thick sections (page 16). Designed to overcome some of the limits of 7075, 7050 became a reference structural alloy for massive parts.
The key to its success: the transition from chromium to zirconium
To reach this objective, metallurgists changed the alloy chemistry. They replaced chromium, historically used in 7075 to control grain structure, with zirconium.
Chromium can reduce part of the alloy’s hardening potential during cooling. Zirconium, by contrast, helps keep alloying elements in solid solution, even when the quench rate decreases.
Identity and metallurgical logic behind 7050
Although the industry usually refers to it simply as 7050, its official designation varies by standard system. In Europe, it is standardized as EN AW-7050, while in the United States it corresponds to UNS A97050.
Its ISO designation is especially revealing: AlZn6CuMgZr. It is therefore an Al-Zn-Mg-Cu alloy, with zirconium added for the structural reasons discussed above.
The performance of 7050 depends on a strict division of roles between beneficial alloying elements and harmful impurities. The table below summarizes this internal logic.
Main elements: mechanisms and expected effects
| Element / group | Function | Metallurgical mechanism | Impact on the material |
|---|---|---|---|
| Zn + Mg | Main hardening system | These two elements combine to generate fine precipitation of hardening phases within the matrix. | Mechanical strength Direct strengthening |
| Zr, instead of Cr as in 7075 | Structure control Chromium replacement | It forms dispersoids that act as pinning points and limit recrystallization under the effect of heat. | Improved toughness Recrystallization inhibition |
| Fe | Major impurity | Iron has low solubility: it precipitates as rigid and brittle intermetallic particles, which can create defects in the material. | Embrittlement Reduced toughness |
| Si | Parasitic impurity | It tends to bind magnesium and form phases with limited hardening value, reducing the amount of Mg available. | Property loss Less Mg available |
Mechanical properties and temper selection: the art of compromise
The overaging strategy: common 7050 tempers
7050 owes much of its reliability to specific heat treatments known as “overaging”. Aging is pushed beyond the peak hardness condition in order to trade some mechanical strength for improved corrosion resistance.
Two tempers dominate the market, each with its own priority.
- T7451, formerly T73651: safety first.
This is the resilience-oriented choice. Overaging is more pronounced in order to maximize resistance to stress corrosion cracking (SCC). It is preferred for critical parts where corrosion-assisted failure would be unacceptable. - T7651: optimized strength.
Overaging is lighter. It mainly targets exfoliation resistance while retaining higher mechanical properties than T7451. It is the structural performance option when the environment is less aggressive in terms of SCC.
Here, the “51” suffix added to the T74 and T76 tempers indicates controlled stress relief by stretching, performed after quenching and before aging. It reduces internal stresses in order to limit distortion during machining.
Typical performance: the strength gap
At comparable geometry, T7651 confirms its status as the stronger temper. The typical values below, measured at 20 °C (68 °F) in the longitudinal direction, show a gain of about 30 MPa in ultimate tensile strength Rm and about 20 MPa in yield strength Rp0,2 compared with T7451, without reducing elongation A or Young’s modulus E.
Typical mechanical properties of T7651 vs T7451, longitudinal direction, Ø 12.7 mm specimen
| Property at 20 °C | 7050-T7651, typ. | 7050-T7451, typ. |
|---|---|---|
| Ultimate tensile strength Rm | 552 MPa | 524 MPa |
| Yield strength Rp0,2 | 489 MPa | 469 MPa |
| Elongation A | 11% | 11% |
| Brinell hardness HB | 150 HB | 140 HB |
| Shear strength | 324 MPa | 303 MPa |
| Young’s modulus E | 70.3 GPa | 70.3 GPa |
The thickness effect: guaranteed values on massive products
The difference in behavior becomes more visible on thick sections, especially plate. The table of guaranteed minimum values in the LT direction, or long transverse direction, shows how product geometry affects mechanical properties.
Guaranteed minimum properties in plate, LT direction, by thickness range
| Temper | Thickness | Rm min. | Rp0,2 min. | A min. |
|---|---|---|---|---|
| T7651 | 6.35 – 25.40 mm | 524 MPa | 455 MPa | 8% |
| T7651 | 50.83 – 76.20 mm | 524 MPa | 455 MPa | 7% |
| T7451 | 6.35 – 50.80 mm | 510 MPa | 441 MPa | 9% |
| T7451 | 127.03 – 152.40 mm | 483 MPa | 414 MPa | 4% |
The guaranteed minimum data for plate in the LT direction, or long transverse direction, structure the table around ultimate tensile strength Rm, yield strength Rp0,2 and elongation A by thickness range. For 7050-T7651, Rm = 524 MPa and Rp0,2 = 455 MPa remain constant across the two listed ranges, while A decreases from 8% to 7%. For 7050-T7451, the minimum values decrease clearly at very high thickness, between 127.03 and 152.40 mm.
Physical properties and thermal limits
| Property | Typical value | Comment |
|---|---|---|
| Density | 2.83 g/cm³ | Typical value for a 7xxx-series alloy. |
| Melting range | 524 – 635 °C | Solidus/liquidus range. |
| Young’s modulus E | 71.5 GPa | Intrinsic stiffness of the material. |
| Thermal expansion | 23.5 µm/m·°C | Average between 20 and 100 °C. |
| Thermal conductivity | 154 W/m·K (T7651) / 157 W/m·K (T7451) | Close values; T7451 shows slightly higher conductivity here. |
| Electrical conductivity | 39.5% IACS (T7651) / 40.5% IACS (T7451) | A useful indicator of metallurgical condition. |
Hot behavior: the 260 °C threshold
7050 is designed to operate at moderate temperatures. Analyzing its residual strength after thermal exposure, based on the evolution of ultimate tensile load Ftu, helps assess the loss of properties after heating.
Figure 1: evolution of ultimate tensile strength Ftu of 7050-T7451 by exposure time and temperature
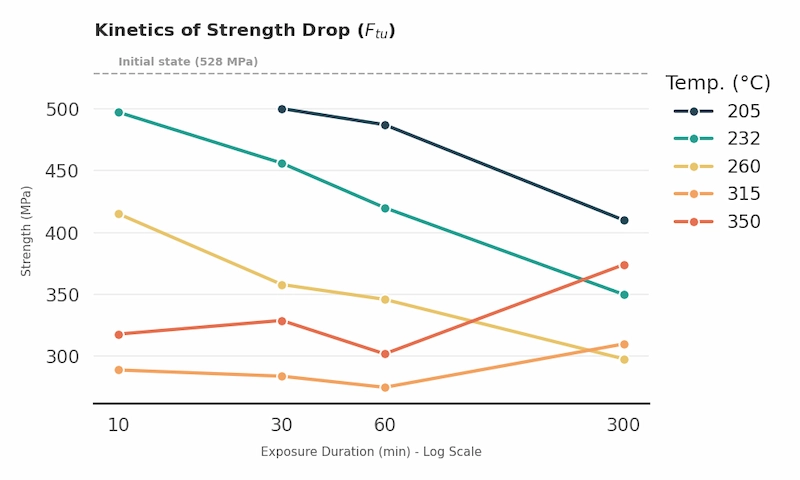
This graph, created from data taken from this document (Table 6), highlights the alloy’s thermal sensitivity. Exposure at 205 °C (401 °F) leads to slow and progressive degradation, while temperatures above 260 °C (500 °F) cause a rapid drop in properties.
Key point: the behavior at very high temperature, especially at 315 °C (599 °F) and 350 °C (662 °F), shows a specific profile. After a marked drop at 60 minutes, strength rises significantly again at 300 minutes. This pattern visible on the curves may reflect complex metallurgical mechanisms linked to aging, partial re-solution or precipitation evolution.
Figure 2: heat map of strength retention rates
Green indicates performance close to the initial condition, while red indicates a critical loss of properties.
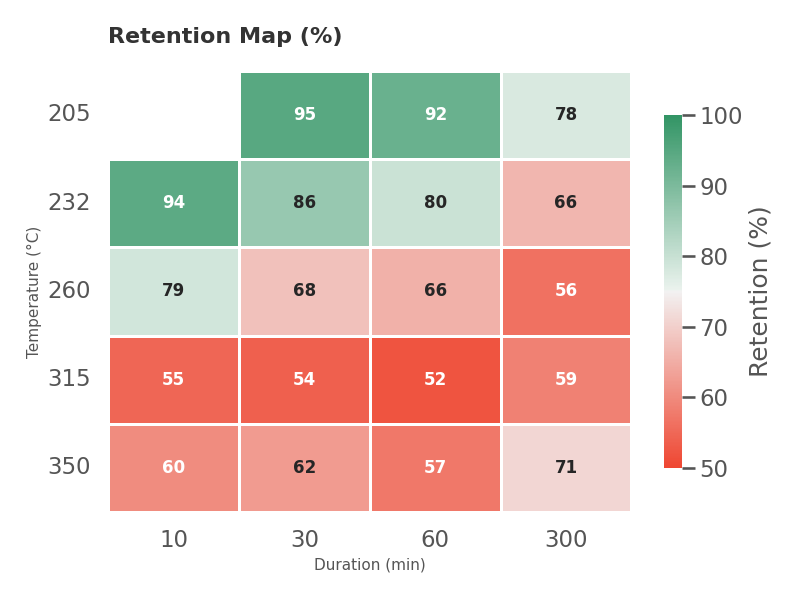
This synthetic view makes it possible to identify danger zones quickly. The alloy retains more than 90% of its capacity when exposure remains moderate, especially up to 232 °C (450 °F) for short durations.
By contrast, once the 260 °C (500 °F) threshold is exceeded or exposure is prolonged, the material moves into the orange and red zones. It may then retain only 50 to 60% of its initial strength, which can compromise the structural integrity of the part.
How resistant is 7050 to stress corrosion cracking?
To qualify resistance to stress corrosion cracking, or SCC, testing does not rely only on service life. It also evaluates a loading threshold: the rating depends on the percentage of yield strength Rp0,2 that the material can withstand without cracking.
- Class A, excellent: no cracking up to 75% of yield strength.
- Class B, good: resistance guaranteed up to 50%.
- Class C, moderate: resistance guaranteed up to 25%.
- Class D, insufficient: failure below 25%.
The table below confirms the strategy described above: the T74 temper family prioritizes corrosion resistance. In the longitudinal (L) and long transverse (LT) directions, both temper families achieve strong results. The difference is mainly seen in the critical direction: short transverse (ST), meaning through the thickness of the material.
- T74 maintains a B rating, or 50%, even in this unfavorable direction.
- T76, optimized for mechanical performance, drops to a C rating, or 25%, in the ST direction on plate and extrusions.
SCC performance by product form and direction
The ratings, taken from this ASM document, apply to the T74 and T76 temper families, including stress-relieved variants such as T7451 and T7651.
| Temper family | Direction | Rolled plate | Rod/bar | Extrusions | Forgings |
|---|---|---|---|---|---|
| T74 | L | A | — | A | A |
| T74 | LT | A | — | A | A |
| T74 | ST, critical | B | — | B | B |
| T76 | L | A | A | A | — |
| T76 | LT | A | B | A | — |
| T76 | ST, critical | C | B | C | — |
Note: the em dash “—” indicates the absence of normative data for this configuration.
Industrial profile of 7050 and fabrication aptitudes
The comparative characteristics table confirms the purpose of 7050. Whether in T7651 or T7451 temper, its workshop behavior remains comparable. It is not primarily intended for deformation or thermal joining. It is a material designed for machined parts, with acceptable anodizing capability.
Summary of aptitudes: forming, machining, welding and anodizing
| Process | Rating | Interpretation |
|---|---|---|
| Machining | B | On an A to E scale: high industrial aptitude. |
| Anodizing | B | On an A to C scale: acceptable aptitude. |
| General corrosion | C | On an A to E scale: protection is generally required, at least on contact surfaces. |
| Spot welding | B | On an A to D scale: weldable subject to testing, procedure qualification and dedicated evaluation. |
| Arc / gas welding | D | On an A to D scale: no common method developed. |
| Cold forming | D | On an A to D scale: limited aptitude. |
Competitive positioning: the thick-section challenge
7050 is specialized for thick sections. Any comparison must therefore be made at comparable thickness, especially in the critical 50 to 150 mm, or 2 to 6 inch, range, where quenching effects become decisive.
Historical comparison: 7050 vs 7075
On thick plate from 63.5 to 76.2 mm, 7050-T7651 outperforms 7075-T651 on the listed mechanical minimums. It provides an ultimate tensile strength Rm that is 28 MPa higher and a yield strength Rp0,2 that is 34 MPa higher, while better addressing the constraints of thick products.
7050 vs 7075 at comparable thickness
| Alloy | Temper | Thickness | Rm min. | Rp0,2 min. | Verdict |
|---|---|---|---|---|---|
| 7050 | T7651 | 63.5 – 76.2 mm | 524 MPa | 455 MPa | Better suited to thick sections |
| 7075 | T651 | 63.5 – 76.2 mm | 496 MPa | 421 MPa | Historical reference |
Geographical comparison: 7050 vs 7010
7050 and 7010 target similar applications, especially massive parts and highly loaded structural components. The difference is mainly linked to industrial standard systems: 7050 is historically associated with the American market, while 7010 is more closely linked to European use.
The table below compares guaranteed minimum values. It shows close performance between the two alloys, even though 7010 may be slightly higher on some lines. The choice between 7050 and 7010 therefore often depends on availability, manufacturer specification and product form rather than on a major metallurgical gap. A complete comparison in T74 condition is available on this page.
7050 vs 7010 at comparable thickness
| Alloy | Product | Temper | Thickness | Rm | Rp0,2 | A | K1c L-T |
|---|---|---|---|---|---|---|---|
| 7010 | Forged | T74 | 100 / 125 mm | > 485 MPa | > 420 MPa | > 7% | > 27 |
| 7050 | Die-forged | T74 | 100 / 125 mm | > 483 MPa | > 414 MPa | > 7% | > 27.5 |
| 7010 | Forged | T7452 | 120 / 150 mm | > 475 MPa | > 400 MPa | > 8% | > 27 |
| 7050 | Forged | T7452 | 150 / 175 mm | > 469 MPa | > 400 MPa | > 9% | — |
Comparison summary
When specifying 7050 for a part, three questions structure the material choice.
- Is thickness critical? If the part exceeds 50 mm, 7050 becomes a priority candidate over 7075.
- Which temper should be selected, T76 or T74? The choice depends on the trade-off between mechanical performance, with T7651, and corrosion/SCC safety, with T7451.
- What is the thermal environment? If the part is exposed to temperatures above 205 °C (401 °F), residual strength curves should be consulted, because property loss becomes rapid beyond 260 °C (500 °F).
Chemical composition of 7050
The mini/maxi variations in its chemical composition accepted for aerospace applications.
| % | Cr Chromium | Cu Copper | Fe Iron | Mg Magnesium | Mn Manganese | Si Silicon | Ti Titanium | Zn Zinc | Zr Zirconium |
|---|---|---|---|---|---|---|---|---|---|
| Min. | 0.00 | 2.00 | 0.00 | 1.90 | 0.00 | 0.00 | 0.00 | 5.70 | 0.08 |
| Max. | 0.04 | 2.60 | 0.15 | 2.60 | 0.10 | 0.12 | 0.06 | 6.70 | 0.15 |
Related aluminum alloys
2014, AlCu4SiMg, 3.1255, EN AW-2014
SHEET (THICKNESS < 6MM)
2014A
RECTANGULAR BAR, ROUND BAR, SHEET (THICKNESS < 6MM)
2017, AlCu4MgSi, AL4
SHEET (THICKNESS < 6MM), SHEET (THICKNESS> 6MM)
2024, AU4G1, 3.1354, EN AW-2024, Al-Cu4Mg1
SQUARE BAR, ROUND BAR, PROFILE, SHEET (THICKNESS < 6MM), SHEET (THICKNESS> 6MM), ROUND TUBE
2050
SHEET (THICKNESS > 6MM)
2219, AlCu6Mn, EN AW-2219
SHEET (THICKNESS > 6MM)
2524
SHEET (THICKNESS < 6MM)
2618, AU2GN, 3.1924, EN AW-AlCu2Mg1,5Ni, AL-P2618A
SHEET (THICKNESS > 6MM), ROUND TUBE
2618A
RECTANGULAR BAR, ROUND BAR, SHEET (THICKNESS > 6MM)
5005, EN AW-5005, EN AW-AlMg1(B)
PERFORATED SHEET
5052, EN AW-5052, EN AW-AlMg2,5, 3.3524, AL-P5052
ROUND TUBE
5086, EN AW-5086, EN AW-AlMg4, 3.3545, AB 5086
ROUND BAR, PROFILE, SHEET (THICKNESS < 6MM), PERFORATED SHEET, ROUND TUBE
5251, 3.3525, EN AW-5251, EN AW-AlMg2, EN AW-AlMgMn0,3
ROUND TUBE
5754, 3.3535, EN AW-5754, EN AW-AlMg3
PERFORATED SHEET
6061, 3.3214, EN AW-6061, EN AW-AlMg1SiCu
ROUND BAR, SHEET (THICKNESS < 6MM), SHEET (THICKNESS> 6MM), ROUND TUBE
6063, EN AW-6063, EN AW-AlMg0,7Si
SHEET (THICKNESS < 6MM)
6082, B221 6082, EN AW-AlSi1MgMn, EN AW-6082
ROUND BAR
7010, AL-P7010, EN AW-7010, EN AW-AlZn6MgCu, 3.4394
SHEET (THICKNESS > 6MM)
7010-7050
SHEET (THICKNESS > 6MM)
7055
SHEET (THICKNESS < 6MM), SHEET (THICKNESS> 6MM)
7075
RECTANGULAR BAR, ROUND BAR, PROFILE, SHEET (THICKNESS < 6MM), SHEET (THICKNESS> 6MM), ROUND TUBE
7075-7175
ROUND BAR
7150
RECTANGULAR BAR
7175
ROUND BAR, PROFILE, SHEET (THICKNESS > 6MM)
7449
SHEET (THICKNESS > 6MM)
7475, AL-P7475, EN AW-7475, EN AW-AlZn5,5MgCu(A), AL6
SHEET (THICKNESS < 6MM), SHEET (THICKNESS> 6MM)
CALE PELABLE
SHEET
L56
ROUND TUBE
Key properties
The most remarkable properties of this aluminum alloy.

Resistivity
0.044–0.047 Ω·mm²/m

Thermal conductivity
154.035–160.958 W/(m·°C)

Density
2.823 kg/dm³

Brinell Hardness
≥ 135 HB

